Microsoft Clarity launches AI Citations report to track content in AI answers
28 days ago
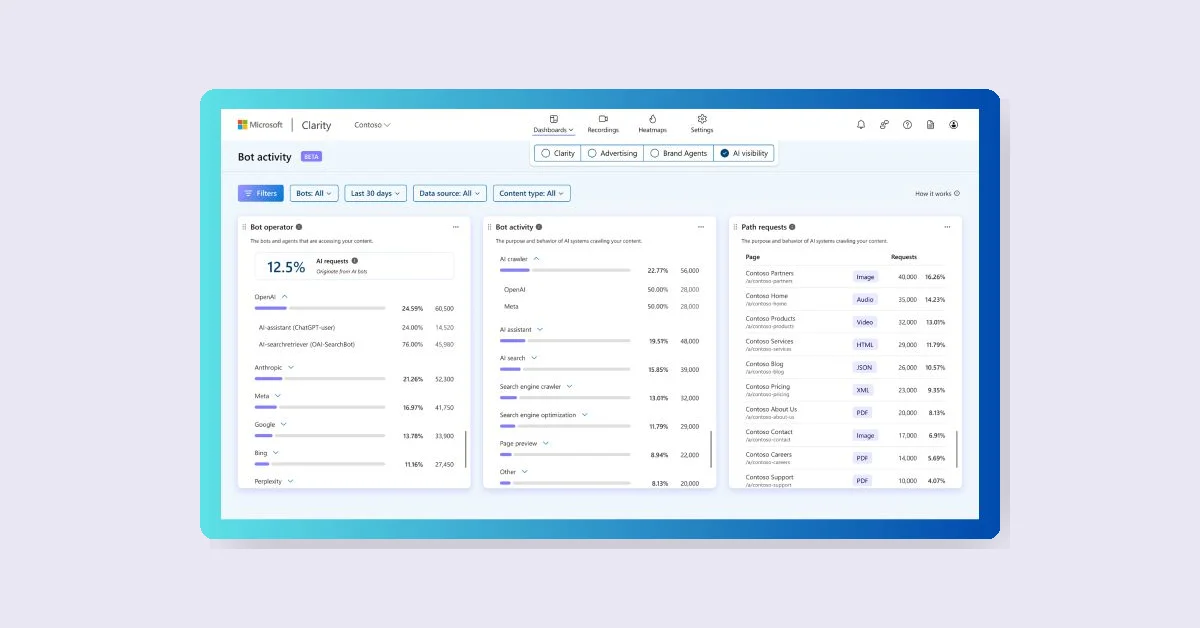
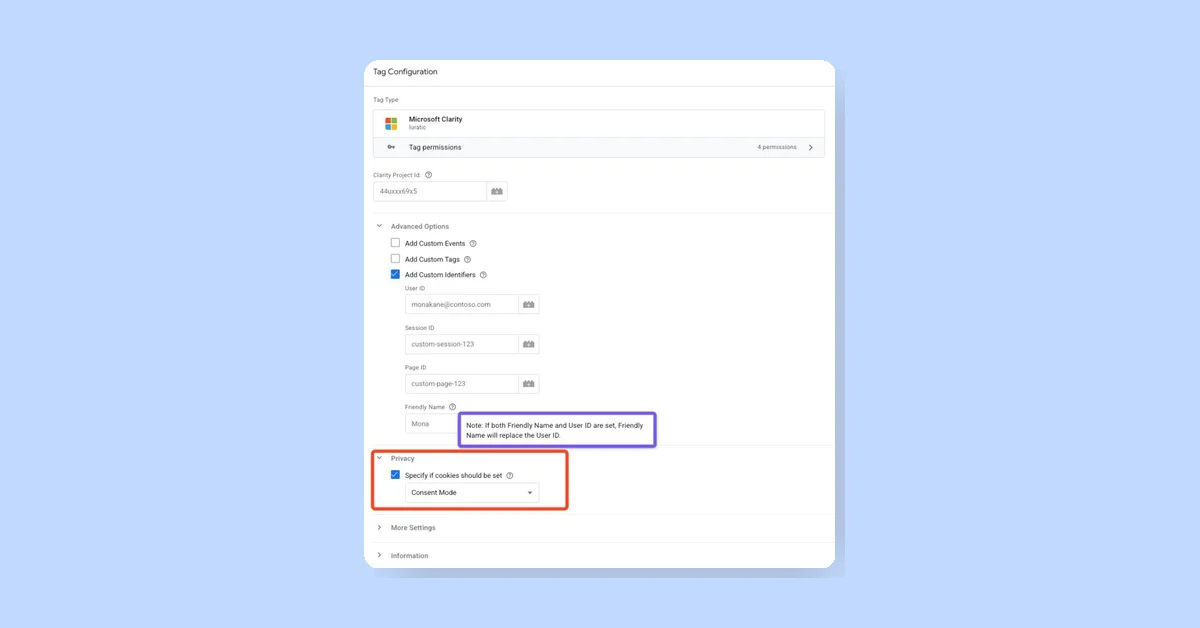
Microsoft Clarity's AI Citations Report shows how content is cited in AI-generated answers, helping site owners track visibility beyond traditional SEO. It measures page citations, share of authority, AI referral traffic, queries, and trends. Now generally available, it requires Clarity setup and domain verification. Future updates will offer deeper insights into content discovery, intent themes, and competitive analysis.