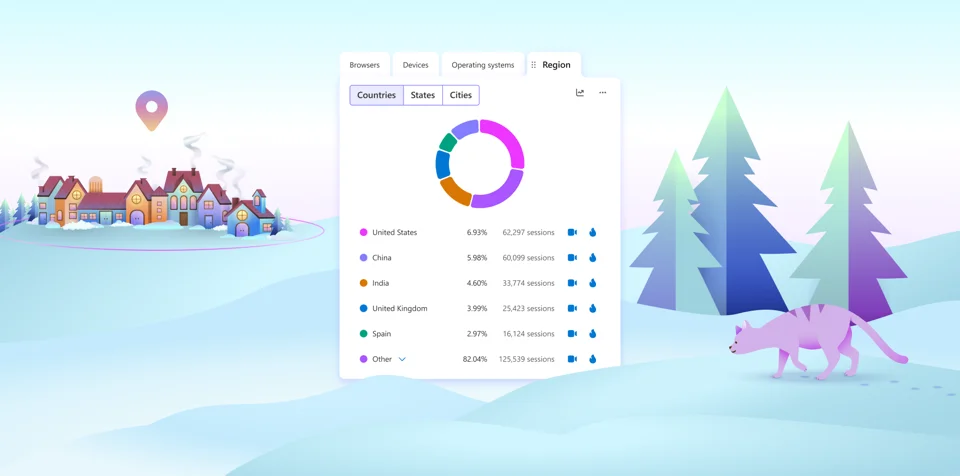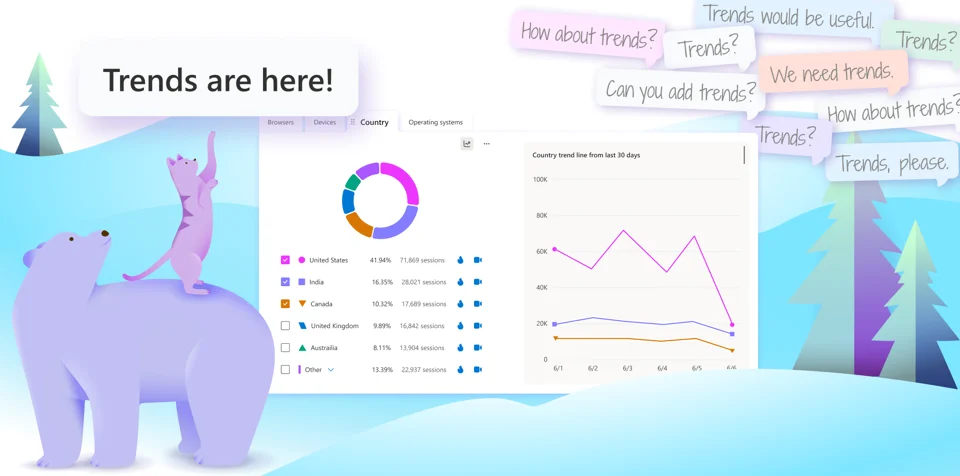
Microsoft Clarity has introduced a new feature called Trends, which adds line graphs to dashboard cards, enabling users to visualize data trends over time. This enhancement helps users move beyond static data points to understand the reasons behind changes in metrics, facilitating smarter and faster decision-making.
Importance of Trends
Trends allow users to:
- Track valuable data changes over time with instant graph visualization.
- Uncover insights by spotting patterns and shifts in data.
- Make informed decisions by understanding the context behind metrics.
Use Cases and Impact
- Marketers can monitor how campaigns affect sessions, engagement, and conversions without needing external tools.
- Product teams can observe user behavior after releases to validate feature adoption or detect friction early.
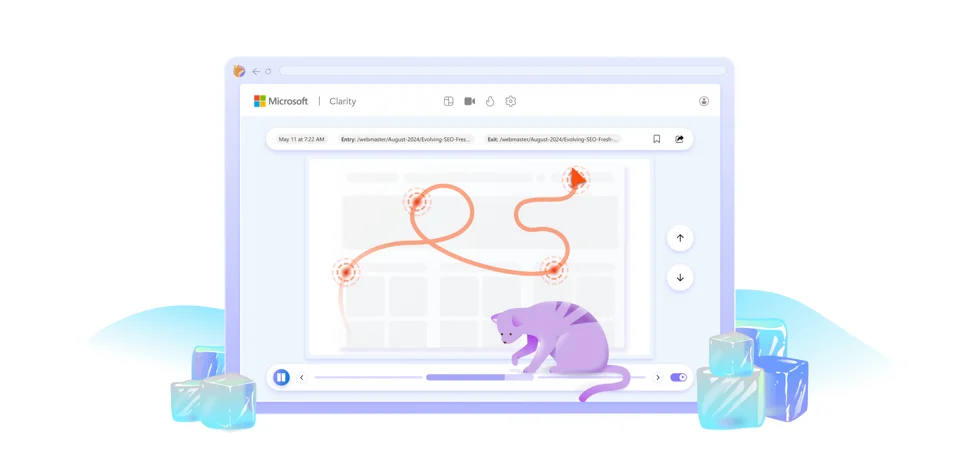
- UX designers can identify sudden changes in scroll depth or rage clicks that may indicate usability problems.
- Stakeholders gain clearer, visually backed insights to understand what works.
How to Use Trends
- Available to all Clarity users with no extra setup.
- Access via the Clarity dashboard by clicking the graph icon on any dashboard card (e.g., Country).
- Trends display data from the last 30 days by default.
Clarity’s Trends feature empowers users to visualize metric changes over time, improving understanding of user behavior and enabling better-informed decisions. This update reflects Clarity’s commitment to user feedback and continuous improvement.