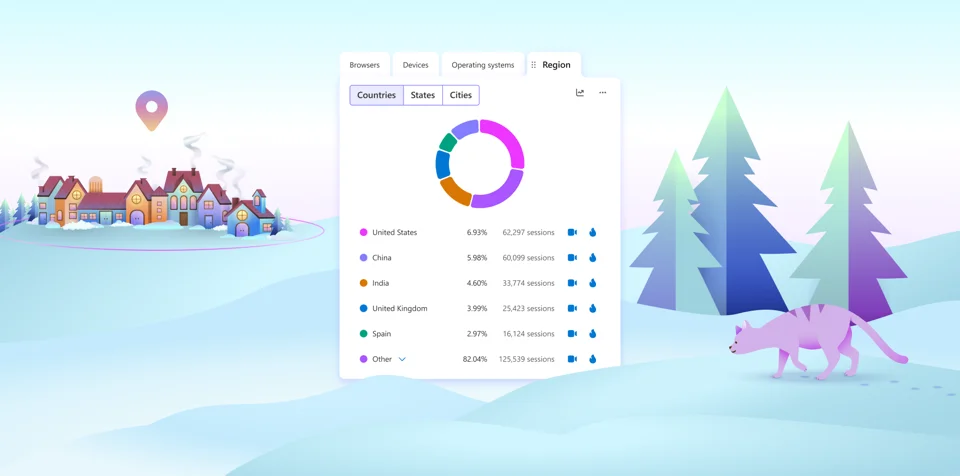
The Clarity Dashboard now includes City and State metrics directly on its dashboard cards, enhancing users' ability to analyze traffic sources at a more granular local level. Previously, only country-level data was prominently displayed, while city and state data were accessible but hidden within the Filters panel, making local insights harder to obtain. This update responds to user demand for more detailed geographical statistics, especially valuable for local businesses.
Enhanced Traffic Analysis
With City and State data visible on dashboard cards, users can quickly compare traffic from specific cities and states—such as New York versus Chicago or California versus Texas—without navigating filters. This facilitates identifying high-performing regions, spotting untapped markets, and understanding how user engagement varies by location.
Targeted Audience Analytics
For businesses operating regionally, these metrics provide clearer insights into local audiences. They support more effective ad campaigns, store performance tracking, and outreach strategies by linking user behavior to specific markets. Users can now easily access data on accesses by city, helping them evaluate communication channels and market reach.
Conclusion
The integration of City and State metrics into the Clarity dashboard cards delivers the local insights users have requested, enabling sharper, location-specific analysis directly from the dashboard. This update supports better decision-making for regional campaigns, market comparisons, and monitoring key markets without leaving the dashboard interface.