Optimizing Interaction To Next Paint (INP): A Step-By-Step Guide provides insights on how to improve the INP metric, part of Google's Core Web Vitals initiative, to enhance website performance and SEO.
INP measures the time in milliseconds between user input and when the browser has finished processing the interaction, ready to display any visual updates. A "Good" score is under 200 milliseconds, while values over half a second are considered "Poor". Google collects INP data from real visitors on your website as part of the Chrome User Experience Report (CrUX), which impacts rankings.
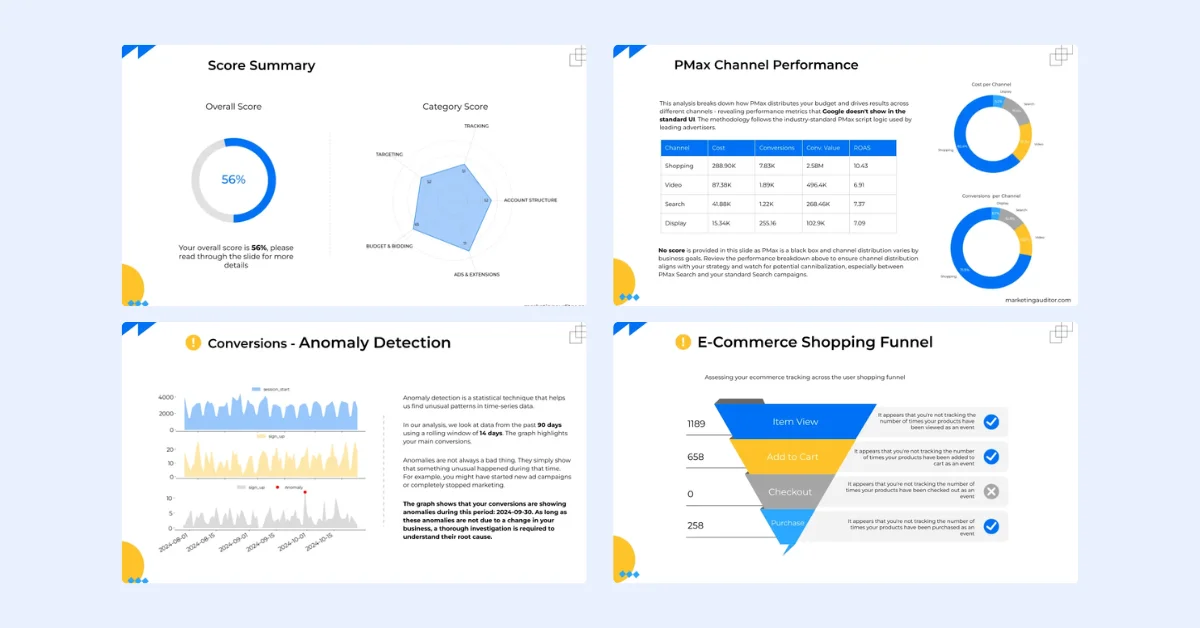
The guide outlines steps to identify and fix slow INP times:
- Identify a Page With Slow INP Times: Use the Core Web Vitals section in Google Search Console or a real-user monitoring tool like DebugBear.
- Figure Out What Element Interactions Are Slow: RUM data provides a breakdown of what page elements users interacted with and how big the interaction delays were.
- Identify What INP Component Contributes The Most To Slow Interactions: INP delays can be broken down into three components: Input Delay, Processing Time, and Presentation Delay.
- Check Which Scripts Are Contributing To Slow INP: Browsers report specific scripts that are contributing to a slow interaction. Both first-party and third-party scripts can contribute to slow INP times.
- Identify Why Those Scripts Are Running: DebugBear offers a breakdown that helps see why the code is running.
The guide also provides specific methods to investigate High Input Delay and High Presentation Delay.
DebugBear monitors lab data, CrUX data, and real user data, providing all the data needed to optimize your Core Web Vitals in one place.