Summary
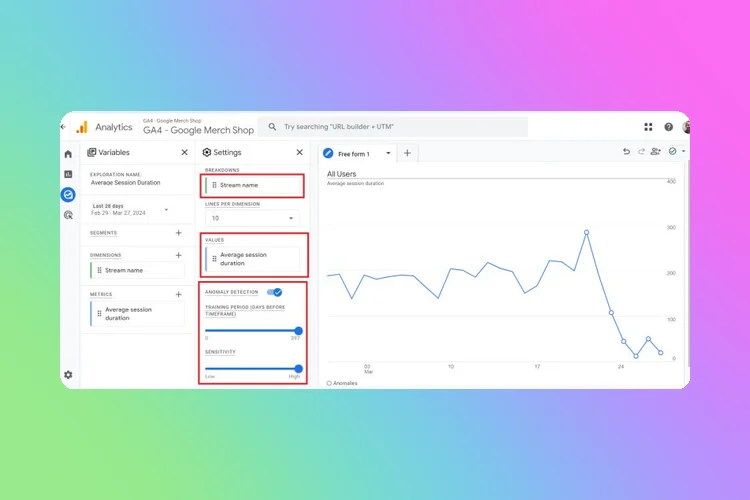
To report on session duration in GA4, create a blank exploration report and add 'Stream name' dimension and 'Average session duration' metric. Change the visualization to a 'Line chart' and set the 'GRANULARITY' to 'Day'. Ensure 'ANOMALY DETECTION' is on to identify and display outliers, which appear as small circles on the chart. Adjust 'TRAINING PERIOD (DAYS BEFORE TIMEFRAME)' and 'SENSITIVITY' under 'ANOMALY DETECTION' to maximum for accurate anomaly detection.