Google AI Mode now offers interactive data visualizations and graphs specifically for finance queries related to stocks and mutual funds. This feature, rolling out in AI Mode in Labs, allows users to compare and analyze financial data over specific time periods through custom-built interactive charts and detailed explanations.
Key Features
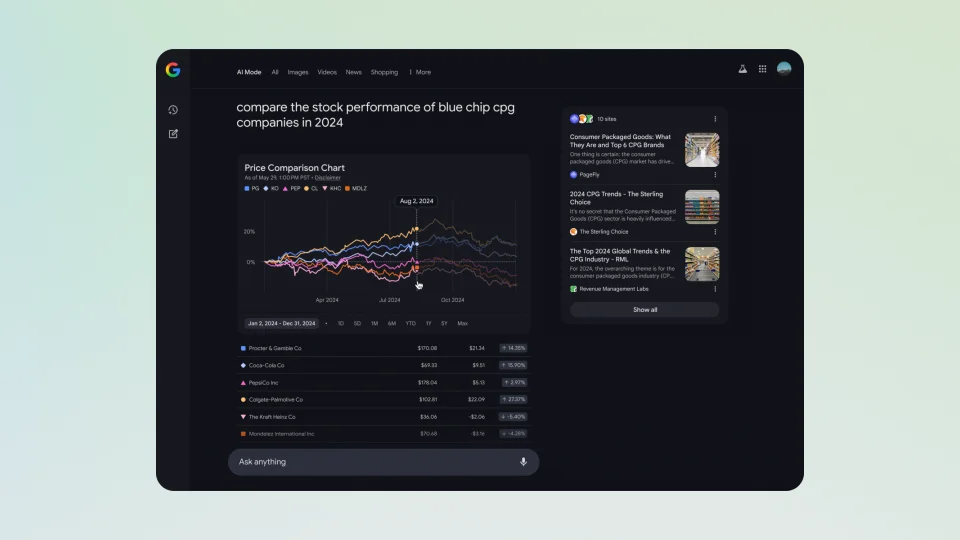
- Users can ask complex questions like comparing stock performance of blue chip CPG companies in 2024.
- AI Mode leverages Gemini’s advanced multi-step reasoning and multimodal capabilities to gather and analyze data, eliminating the need for manual research.
- Follow-up questions, such as inquiries about dividend payments, are understood contextually by AI Mode, which continues to provide relevant information.
- The system uses advanced models to interpret user intent, access real-time and historical data, and present it in an easy-to-understand visual format.
This enhancement aims to make financial data more accessible and insightful through interactive visual tools.