Google Chrome has introduced new features in DevTools to enhance performance debugging using real-world data, particularly focusing on CPU throttling calibration. This aims to bridge the gap between development environments and the performance experiences of users on various devices.
CPU Throttling Calibration
With Chrome 134, a new CPU throttling calibration tool allows developers to generate specific "low-tier mobile" and "mid-tier mobile" throttling presets based on their development machine. This addresses the common issue where developers build on high-performance desktop devices while users may be on slower mobile devices.
Calibration Process
To calibrate, developers can access the Performance panel and select the calibration option. A benchmark runs to measure the machine's speed, resulting in calibrated presets that can be used for most development scenarios. The "mid-tier" preset is recommended for typical mobile devices, while the "low-tier" option is for users with slower devices.
How CPU Throttling Works
CPU throttling in DevTools operates by suspending the main thread of a tab for short bursts, simulating how tasks would execute on mobile devices. For instance, at 4x throttling, the main thread is suspended about 75% of the time, effectively slowing down task completion.
Realistic Simulation of Mobile Performance
The calibrated throttling presets can accurately simulate mobile performance for CPU-bound tasks. For example, a click interaction on a desktop with mid-tier mobile CPU throttling shows similar performance metrics to that on a real mobile device, demonstrating the effectiveness of this method.
Limitations of CPU Throttling
Despite its advantages, CPU throttling cannot replicate all aspects of mobile hardware, such as slower disk speeds and GPU differences. Performance issues related to GPU-intensive tasks may not be accurately represented, making it essential to test on actual mobile devices for comprehensive performance analysis.
Additional Data-Driven Debugging Features
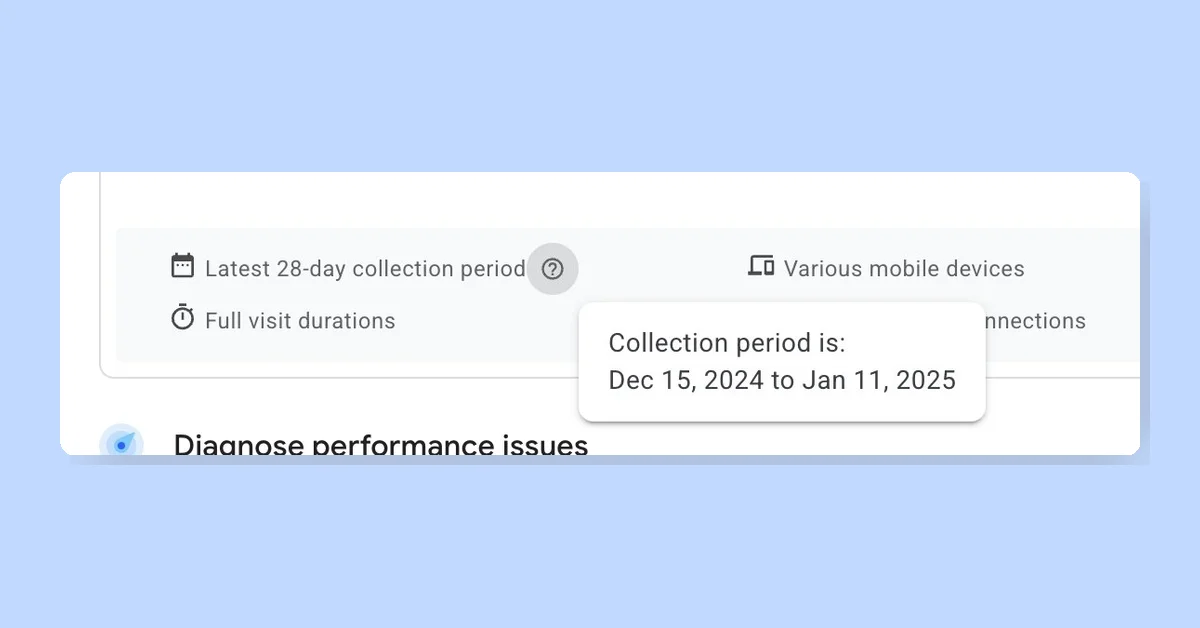
Recent updates also include features that leverage field data to guide debugging decisions. The Performance panel now provides suggestions based on user metrics from the Chrome User Experience Report (CrUX) and alerts when local metrics diverge from real-world data. Insights in the sidebar help prioritize performance improvements based on user experience.
Conclusion
The new DevTools features aim to enhance performance debugging by integrating real-world data and reducing guesswork in configuration. By focusing on accurate simulations and providing insights based on user metrics, developers can better address performance issues affecting their users.