Google Chrome introduces WebMCP, a new standard to enable faster, more reliable AI interactions on websites by exposing structured tools. It offers two APIs: Declarative for standard HTML actions and Imperative for complex JavaScript tasks. WebMCP enhances agent workflows in areas like customer support, ecommerce, and travel by allowing precise, automated actions. An early preview program is available for prototyping.
Markifact is a no-code marketing automation platform that lets users create AI-driven workflows for automating marketing tasks. Users can trigger workflows, connect apps, and track performance through a visual interface. The platform offers pre-built templates, integrates with various marketing tools, and supports team collaboration.
Lighthouse is moving to performance insight audits, consolidating various performance tools. Several audits will be renamed or merged, while outdated ones will be removed. Breaking changes will affect API users, with the next major release, Lighthouse 13, planned for October 2025. Users can start migrating to the new insights now, with a toggle feature in Lighthouse 12.6. Documentation for the new audits will be available before the transition.
Chrome DevTools introduces CPU throttling calibration to improve performance debugging using real-world data. This feature allows developers to create low-tier and mid-tier CPU throttling presets specific to their machines, addressing performance discrepancies between desktop and mobile devices. While CPU throttling effectively simulates mobile performance, it cannot replicate all hardware aspects, particularly GPU tasks.
Google has ended the Web Vitals Chrome extension with Chrome 132, finalizing the integration of Core Web Vitals into the DevTools Performance panel. Users will get end-of-support warnings, and the CrUX API key will be revoked. A migration guide is available for transitioning to DevTools, and instructions for keeping a local copy of the extension are provided for those who cannot migrate. Google will continue to improve the Performance panel's features.
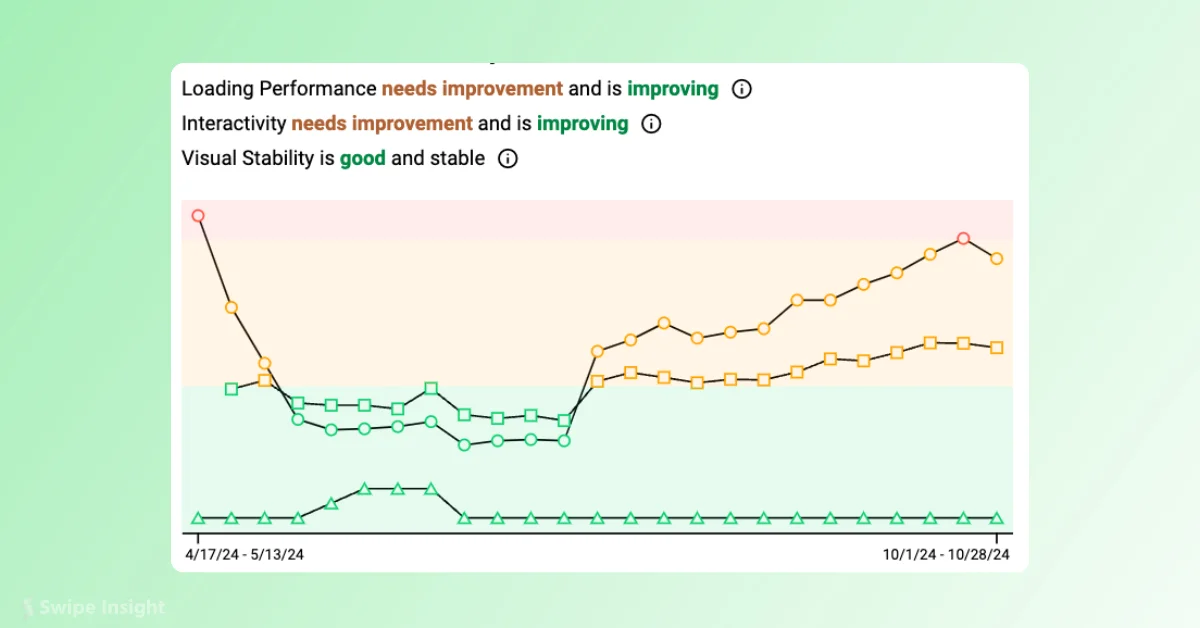
Google has launched CrUX Vis, a new tool for the Chrome User Experience Report, enhancing analysis of real-world user data. CrUX Vis offers an intuitive interface with five views: Core Web Vitals, Loading Performance, Interactivity, Visual Stability, and All Metrics Combined. Key features include real-world data visualization, comparative analysis, temporal insights, device and connection type segmentation, and geographical breakdown.