Looker Studio Rolls Out Bins for Flexible Metric Buckets

June 12, 2024 at 5:09:35 PM - Trending πŸ”₯

TL;DR New Looker Studio feature "Bins" allows for flexible metric bucketing with equal or custom sizes, simplifying data categorization and analysis. This enhances the creation of insightful visualizations and reports, marking a significant improvement over traditional CASE WHEN expressions.

Looker Studio Rolls Out Bins for Flexible Metric Buckets

Looker Studio has introduced a new feature called "Bins" that allows for more flexible metric bucketing with either equal or custom sizes. This feature simplifies data categorization and analysis, enhancing the creation of insightful visualizations and reports. Bins are a significant improvement over the traditional CASE WHEN expressions.

Key Features of Bins

  • Ad Hoc Numeric Tiers: The Bin calculated field type allows users to create numeric tiers for numeric dimensions without needing to develop CASE WHEN expressions or logic in SQL.
  • Granularity Adjustment: Quickly group values into specific integer ranges to adjust data granularity.
  • Maximum Bins: A maximum of 195 total bins can be created for each Bin field type.

Examples of Using Bins in Looker Studio

  • Sales Revenue Ranges: Group sales revenue into predefined bins such as $0-$500, $501-$1000, and $1001-$1500 to quickly analyze different revenue segments without writing complex CASE WHEN statements.
  • Age Groups: Create bins for age groups like 18-25, 26-35, 36-45, etc., to easily segment and analyze demographic data in your reports.
  • Session Duration Ranges: Group session durations into bins such as 0-30 seconds, 31-60 seconds, and 61-120 seconds to analyze how long users stay on your site.
  • Order Quantity Tiers: Segment order quantities into bins such as 1-10, 11-20, 21-30, allowing for rapid assessment of order distribution and identifying trends across different order sizes.

Creating Custom Bins

In Data Source

  1. Edit the Data Source: You must have edit rights.
  2. Add a Field: Click "Create new" and select "Add bin". Screenshot at Jun 12 21-26-59.png
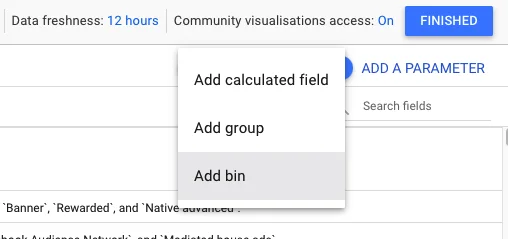
  3. Select Existing Field: Choose a field to bin by from the drop-down menu.
  4. Specify Name and ID: Provide a unique name and optionally edit the default ID.
  5. Refresh Field Info: Optionally, refresh field info to get dimension values.
  6. Specify Bin Type:
    • Equal Sized: Bin numeric values into equal integer ranges.
    • Custom Sized: Create custom bin sizes of varying integer ranges. Screenshot at Jun 12 21-16-01.png
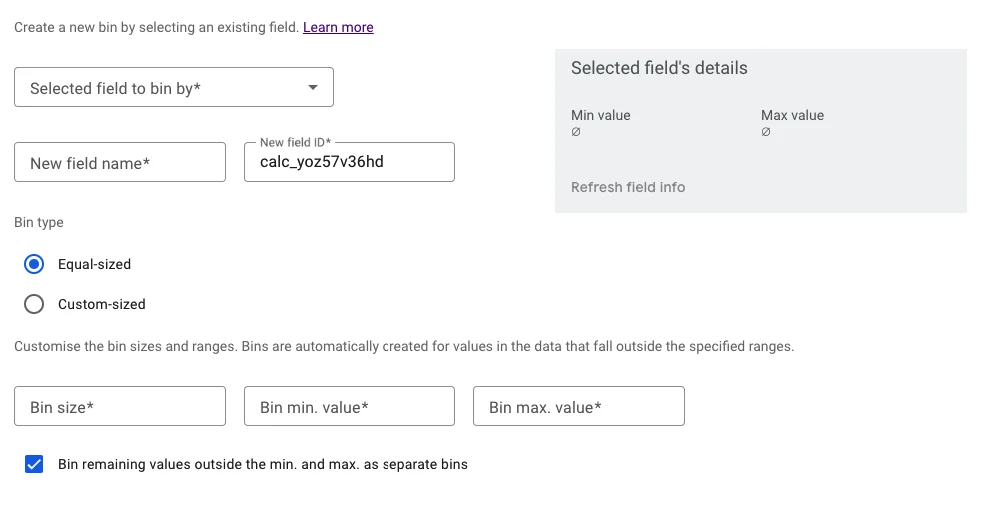
  7. Customize Bin Sizes: Enter values for bin size, minimum, and maximum values.
  8. Save: Click "Save" to finalize.

From a Report

  1. Create/Edit Report: In the Data panel, click "Create new" and select "Add bin".
  2. Follow Steps Similar to Data Source: Follow similar steps as creating in a data source.

Editing Custom Bins

  • In Data Source: Edit the formula by clicking the fx symbol next to the field name.
  • Chart-Specific Custom Bins: Field Editing in Reports must be enabled, and you must have edit rights. Chart-specific bins exist only in the chart where they are created.

edit looker studio bin

Reusing Chart-Specific Custom Bins

  • Chart-specific calculated fields can only be reused by copying the chart containing them. The copy will retain the calculated fields, which can then be edited as needed.

For more detailed instructions and examples, refer to the Looker Studio Help.

Q&A

Have more questions on this topic? Ask our AI assistant for in-depth insights.

The Only Digital Marketing Feed You'll Ever Need.

Stay informed your way. Tailored updates when and how you want them. 100% Free.

10,000+ Users

500+ Sources

1000+ Tools

Or

Related Posts

The Ultimate Google Analytics Audit Tool

The Ultimate Google Analytics Audit Tool

Featured
Looker Studio Updates Table Limits and Security Features

Looker Studio Updates Table Limits and Security Features

Google Cloud
Google Cloud

Official Source

Official Source

Google Cloud is a Official Source. The source has been verified by Swipe Insight team.

Official Source
Looker Studio Unveils Data Preview and Enhanced Visualization Controls

Looker Studio Unveils Data Preview and Enhanced Visualization Controls

Google Cloud
Google Cloud

Official Source

Official Source

Google Cloud is a Official Source. The source has been verified by Swipe Insight team.

Official Source
Google updates Looker Studio with advanced filtering and connector enhancements

Google updates Looker Studio with advanced filtering and connector enhancements

Google Cloud
Google Cloud

Official Source

Official Source

Google Cloud is a Official Source. The source has been verified by Swipe Insight team.

Official Source
Looker Studio Introduces Automated Chart Titling and Enhanced SA360 Integration

Looker Studio Introduces Automated Chart Titling and Enhanced SA360 Integration

Google Cloud
Google Cloud

Official Source

Official Source

Google Cloud is a Official Source. The source has been verified by Swipe Insight team.

Official Source
Looker Studio Enhances Filter Visibility and Functionality with New Updates

Looker Studio Enhances Filter Visibility and Functionality with New Updates

Google
Google

Official Source

Official Source

Google is a Official Source. The source has been verified by Swipe Insight team.

Official Source
Looker Studio Enhances Date Picker Interface

Looker Studio Enhances Date Picker Interface

Josh Silverbauer
Josh Silverbauer

Top Creator

Top Analytics Creator

Josh Silverbauer is a Top Analytics Creator. Part of Swipe Insight Select, a curated list of top creators.

Top Analytics Creator
Looker Studio Expands SA360 Connector with New Cart Conversion Fields

Looker Studio Expands SA360 Connector with New Cart Conversion Fields

Google Cloud
Google Cloud

Official Source

Official Source

Google Cloud is a Official Source. The source has been verified by Swipe Insight team.

Official Source

Related Tools

Marketing Auditor logo

Marketing Auditor

Verified Tool

Verified Tool

Marketing Auditor is a Verified Tool. Want to get this badge? Contact us.

Verified Tool

Automated audits for Google Ads and Analytics.

Get Featured Here

Showcase your tool in this list.

Contact Us
Dokin logo

Dokin

Sync and visualize data in Sheets and Looker

Reporting
Looker Studio logo

Looker Studio

Transform data into insightful visual reports

Data Visualization
Power My Analytics logo

Power My Analytics

Automate and integrate your marketing data

Reporting
Windsor.ai logo

Windsor.ai

AI-driven marketing data attribution and insights

Reporting
Porter logo

Porter

No-code data integration for marketing analytics

Reporting
Data Bloo logo

Data Bloo

Looker Studio Report Templates in Minutes

Data Visualization

Get Featured Here

Showcase your tool in this list.

Contact Us