Looker Studio Enhances Data Visualization with New Funnel Charts

September 27, 2024 at 5:49:45 AM - Trending πŸ”₯

TL;DR Google updates Looker Studio with a new funnel chart and Excel connector. The funnel chart visualizes metrics over sequential events with features like flexible sorting, automatic data labels, and interactive tooltips. The Excel connector allows direct data access and analysis. These enhancements improve data storytelling, integration, flexibility, and workflow, making Looker Studio more user-friendly for data analysis and visualization.

Looker Studio Enhances Data Visualization with New Funnel Charts

Google has rolled out significant updates to Looker Studio, its data visualization and business intelligence platform. These updates include a new funnel chart option and a Microsoft Excel connector, both aimed at improving data analysis and reporting capabilities for users.

1. New Funnel Chart Visualization

What's New:

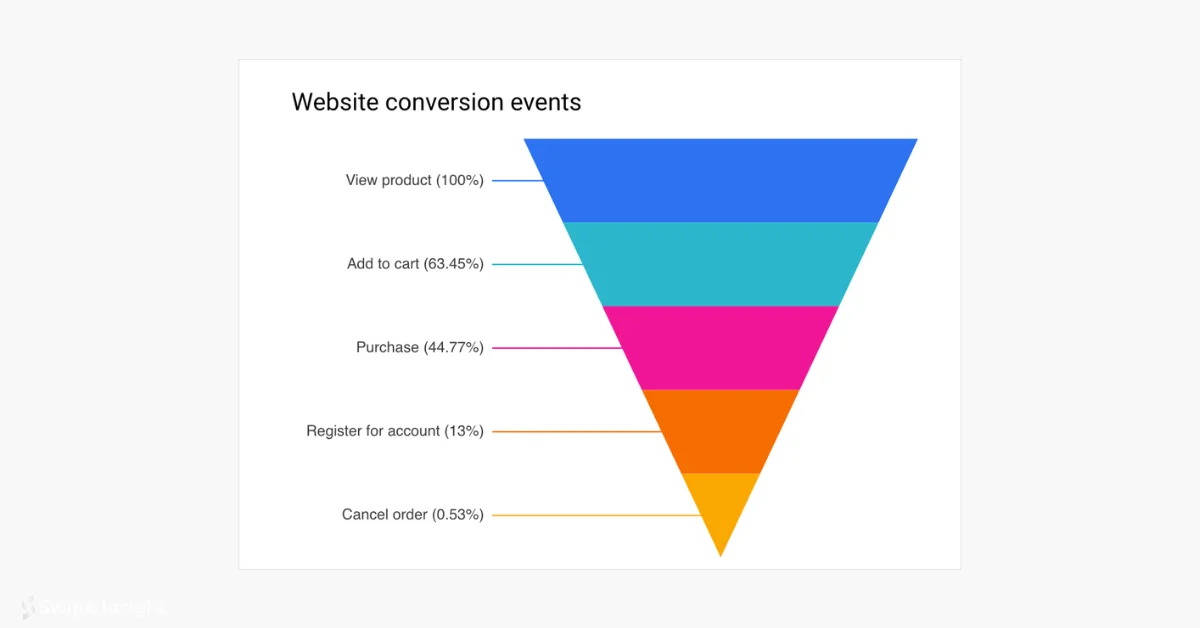
Looker Studio now offers a funnel chart option, allowing users to visualize how metrics change over sequential events in a process.

Key Features:

  • Versatile Visualization: Ideal for displaying sales pipelines, marketing campaign engagement, or website visitor flow.
  • Flexible Sorting: Charts can be sorted by metrics in ascending or descending order, or alphabetically by dimensions.
  • Automatic Data Labels: Labels appear inside or outside bars depending on available space.
  • Interactive Tooltips: Hovering over bars reveals detailed information.

Configuration Requirements:

  • Dimension: Labels each step in the funnel.
  • Metric: Measures events and determines bar width.
  • Sort Field: Defines the order of events in the chart.

Style Options:

Users can choose from various funnel styles including:

  • Smoothed bar
  • Stepped bar
  • Inverted triangle

2. Microsoft Excel Connector

Looker Studio now includes a connector for Microsoft Excel, enhancing data integration capabilities. Users can directly access and analyze data stored in Excel worksheets within Looker Studio, streamlining the data import process.

Impact for Users:

These updates significantly enhance Looker Studio's functionality:

  1. Improved Data Storytelling: Funnel charts offer a powerful way to visualize and communicate process flows and conversion rates.

  2. Enhanced Data Integration: The Excel connector bridges a gap between common data sources and Looker Studio's analysis tools.

  3. Greater Flexibility: With more visualization options and data sources, users can create more comprehensive and insightful reports.

  4. Streamlined Workflow: Direct Excel integration reduces the need for data transformation steps before analysis.

These new features demonstrate Google's commitment to making Looker Studio a more versatile and user-friendly platform for data analysis and visualization. Users are encouraged to explore these new capabilities to enhance their reporting and decision-making processes.

For detailed instructions on using these new features, users should refer to the official Looker Studio documentation.

Have more questions on this topic? Ask our AI assistant for in-depth insights.

Read more from sources πŸ‘‡

The Only Digital Marketing Feed You'll Ever Need.

Stay informed your way. Tailored updates when and how you want them. 100% Free.

10,000+ Users

500+ Sources

1000+ Tools

Or

Related Posts

Looker Studio Unveils Major Updates with Modern Charts and Enhanced Pivot Tables

Looker Studio Unveils Major Updates with Modern Charts and Enhanced Pivot Tables

Google Cloud
Google Cloud

Official Source

Official Source

Google Cloud is a Official Source. The source has been verified by Swipe Insight team.

Official Source
Looker Studio Updates Table Limits and Security Features

Looker Studio Updates Table Limits and Security Features

Google Cloud
Google Cloud

Official Source

Official Source

Google Cloud is a Official Source. The source has been verified by Swipe Insight team.

Official Source
Tired of spending too much time creating audits for your clients?

Tired of spending too much time creating audits for your clients?

Featured
Looker Studio Unveils Data Preview and Enhanced Visualization Controls

Looker Studio Unveils Data Preview and Enhanced Visualization Controls

Google Cloud
Google Cloud

Official Source

Official Source

Google Cloud is a Official Source. The source has been verified by Swipe Insight team.

Official Source
Google updates Looker Studio with advanced filtering and connector enhancements

Google updates Looker Studio with advanced filtering and connector enhancements

Google Cloud
Google Cloud

Official Source

Official Source

Google Cloud is a Official Source. The source has been verified by Swipe Insight team.

Official Source
Looker Studio Introduces Automated Chart Titling and Enhanced SA360 Integration

Looker Studio Introduces Automated Chart Titling and Enhanced SA360 Integration

Google Cloud
Google Cloud

Official Source

Official Source

Google Cloud is a Official Source. The source has been verified by Swipe Insight team.

Official Source
Looker Studio Enhances Filter Visibility and Functionality with New Updates

Looker Studio Enhances Filter Visibility and Functionality with New Updates

Google
Google

Official Source

Official Source

Google is a Official Source. The source has been verified by Swipe Insight team.

Official Source
Looker Studio Enhances Date Picker Interface

Looker Studio Enhances Date Picker Interface

Josh Silverbauer
Josh Silverbauer

Top Creator

Top Analytics Creator

Josh Silverbauer is a Top Analytics Creator. Part of Swipe Insight Select, a curated list of top creators.

Top Analytics Creator

Related Tools

Marketing Auditor logo

Marketing Auditor

Verified Tool

Verified Tool

Marketing Auditor is a Verified Tool. Want to get this badge? Contact us.

Verified Tool

Automated audits for Google Ads and Analytics.

Get Featured Here

Showcase your tool in this list.

Contact Us
Dokin logo

Dokin

Sync and visualize data in Sheets and Looker

Reporting
Looker Studio logo

Looker Studio

Transform data into insightful visual reports

Data Visualization
Power My Analytics logo

Power My Analytics

Automate and integrate your marketing data

Reporting
Windsor.ai logo

Windsor.ai

AI-driven marketing data attribution and insights

Reporting
Porter logo

Porter

No-code data integration for marketing analytics

Reporting
Data Bloo logo

Data Bloo

Looker Studio Report Templates in Minutes

Data Visualization

Get Featured Here

Showcase your tool in this list.

Contact Us