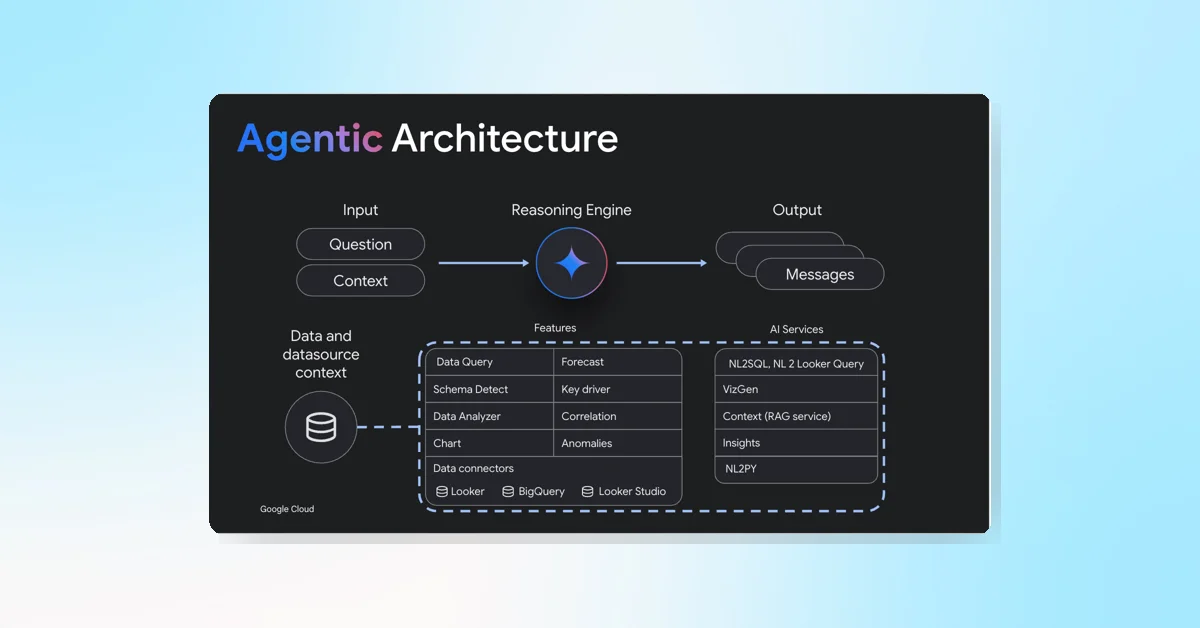
Looker Studio updates introduce several new features enhancing data visualization and report interactivity.
Cross Data Source Filtering
This feature allows users to override default field IDs, enabling controls on a report to filter charts that come from different data sources. This improves the flexibility of filtering across multiple datasets within a single report.
Show and Hide Individual Charts and Components
Users can now hide specific charts and components either for all viewers or selectively for certain viewers. This feature helps customize the report view depending on the audience.
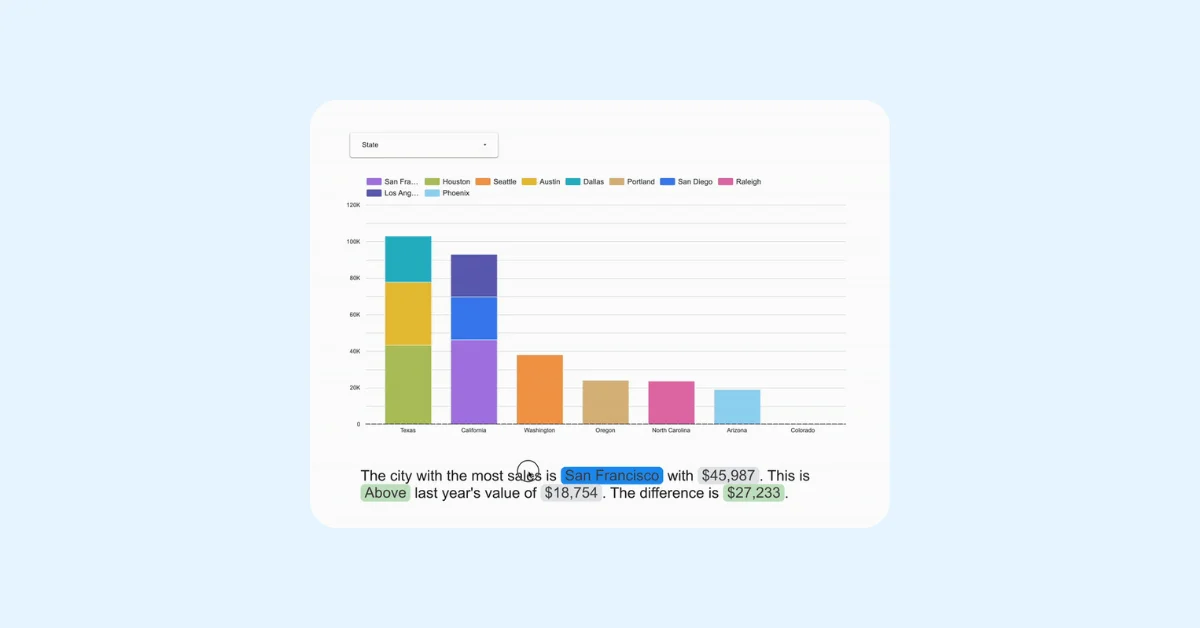
Histogram Chart
Looker Studio now supports histogram charts, which help visualize the distribution of data by showing its shape, center, and spread. Histograms provide insights that may not be visible in other chart types like pie charts or bar charts.