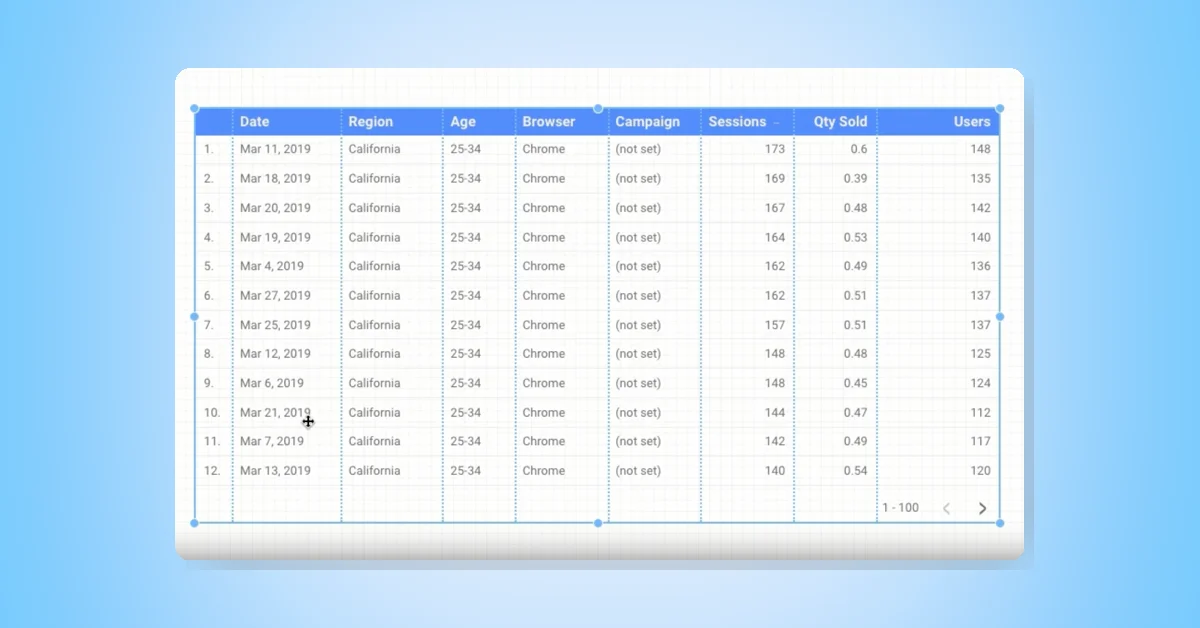
Looker Studio has introduced a powerful new functionality for table charts, allowing viewers to sort by multiple columns simultaneously. Users can now activate this feature by clicking multiple column headers while holding the Shift key.
Tables display your data in a grid of rows and columns. Each column represents a dimension or metric, while each row is one record of your data.
Tables in Looker Studio automatically group your data. Each row in the table displays the unique combination of all the dimensions included in the table definition. Each metric in the table is aggregated according to the aggregation type for that metric (sum, average, count, etc.).