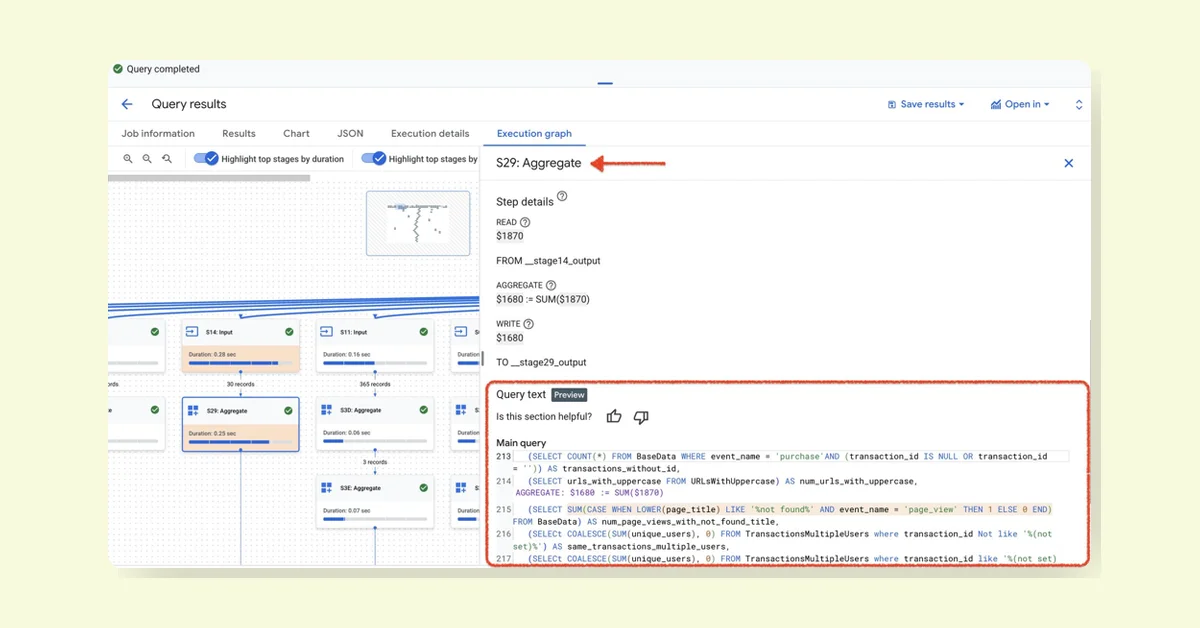
BigQuery has rolled out a new feature that allows users to view the query text directly inside the execution graph. This update creates a clear connection between query text and execution behavior, making it significantly easier to identify performance bottlenecks.
Bridging the Gap Between SQL and Execution
The new feature displays exactly which part of the SQL corresponds to each stage step in the execution process. This direct mapping eliminates the guesswork previously required when trying to determine where performance issues might be occurring in complex queries.
Key Benefits for Debugging
With this update, users can now easily see:
- Which step comes from which subquery
- What was read, aggregated, or written during execution
- Why specific steps (like that "0.28 sec Input" step) are slowing down the overall query performance
Impact on Performance Tuning
While this represents a relatively small user interface update, it delivers substantial benefits for debugging and performance tuning activities. Users can now quickly pinpoint problematic areas in their queries without having to manually trace through execution steps and match them to SQL components.
This feature should prove particularly valuable for data engineers and analysts working with complex, multi-part queries where performance optimization is crucial.