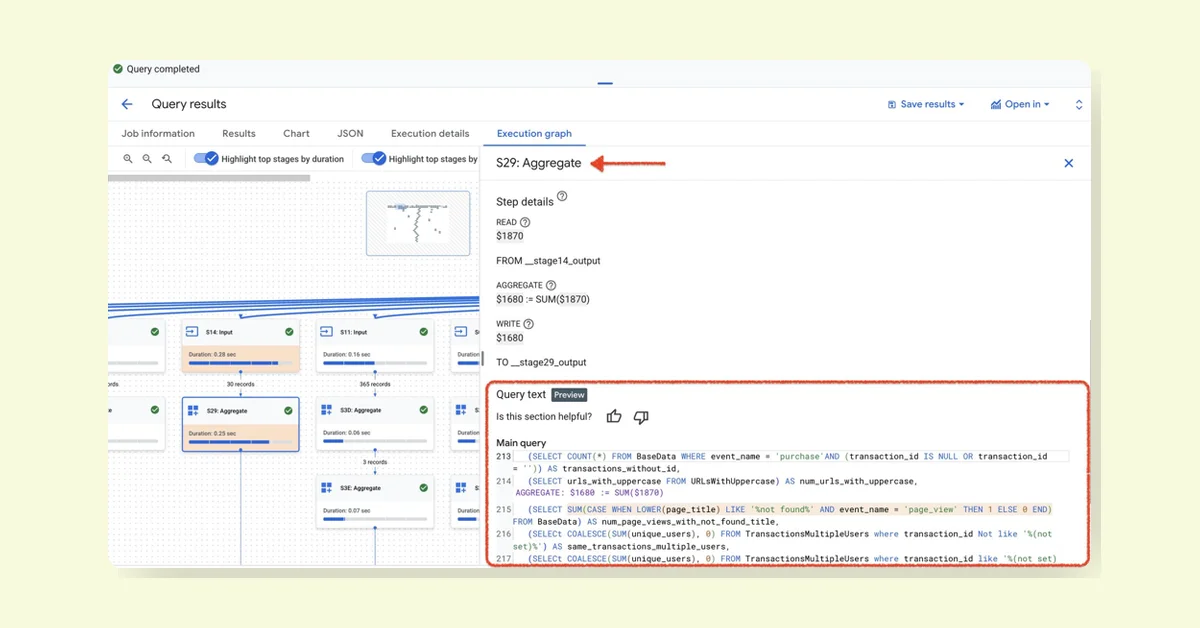
BigQuery has introduced a feature allowing users to view Query text within the Execution graph. This shows which part of the SQL corresponds to each stage step, helping identify bottlenecks. Users can see the source of each subquery, what data was read, aggregated, or written, and understand why certain steps, like the "0.28 sec Input," may be causing delays. This small UI update significantly aids in debugging and performance tuning.
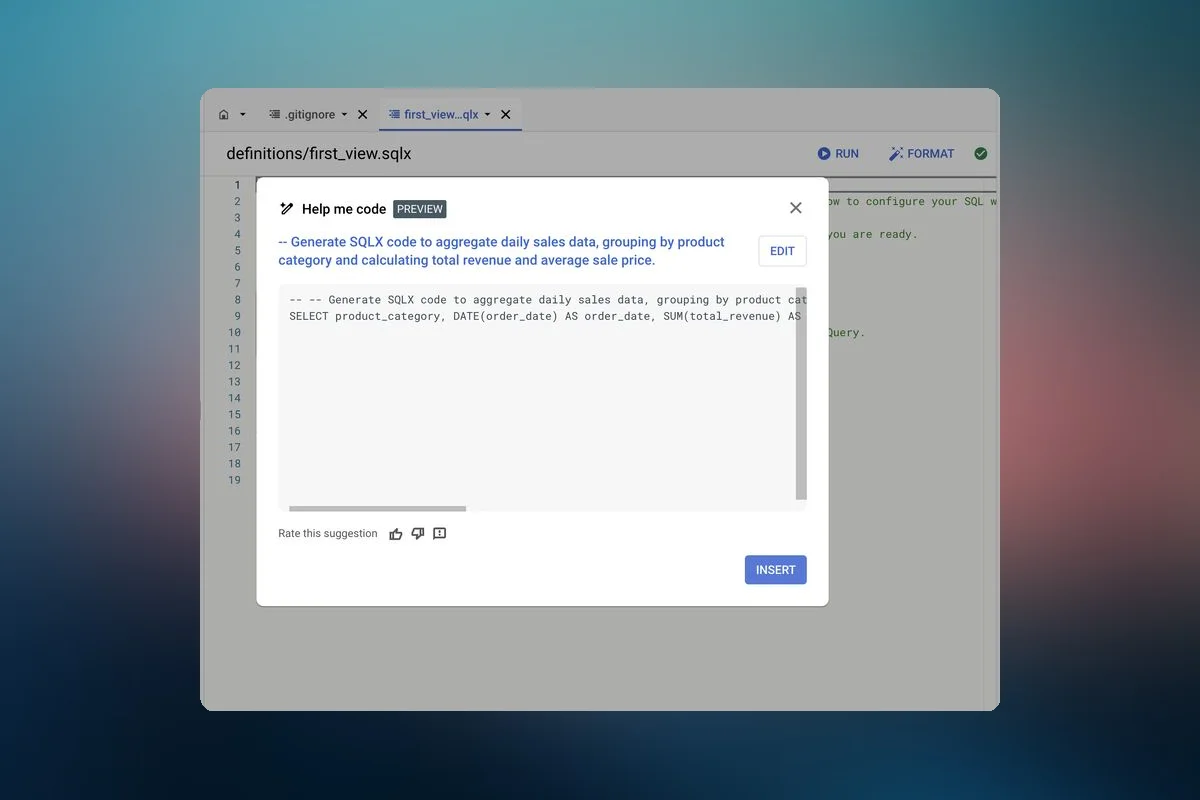
Google's AI-powered collaborator, Gemini, is now available in preview for Dataform users to generate SQLX code. SQLX, an extension of SQL used in Dataform, manages and transforms data through scripts that combine SQL with additional configurations like js. Gemini automates script creation, reducing errors and improving code quality. The feature is currently in preview, hinting at the future of data transformation projects.
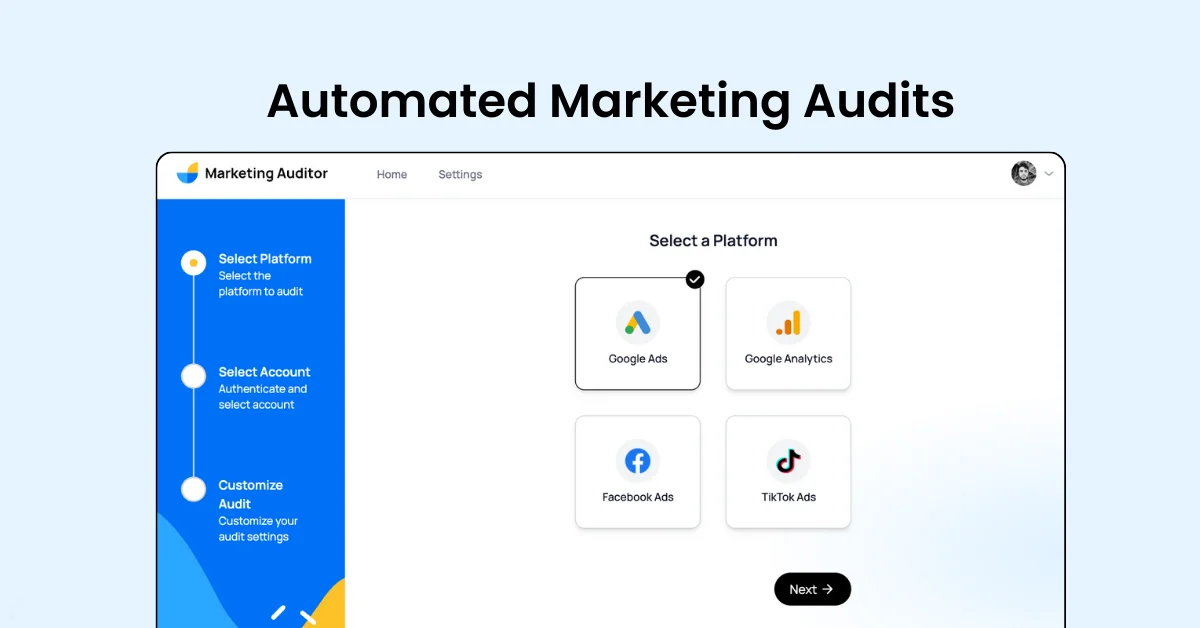
Marketing Auditor simplifies your audit process, letting you generate comprehensive, white-label reports in just a few clicks. Save over 10 hours per report while analyzing 200+ data points and delivering 50+ pages of actionable insights. Customize reports with professional themes or your own branding, and export them in editable formats like PowerPoint or Google Slides to showcase your expertise.