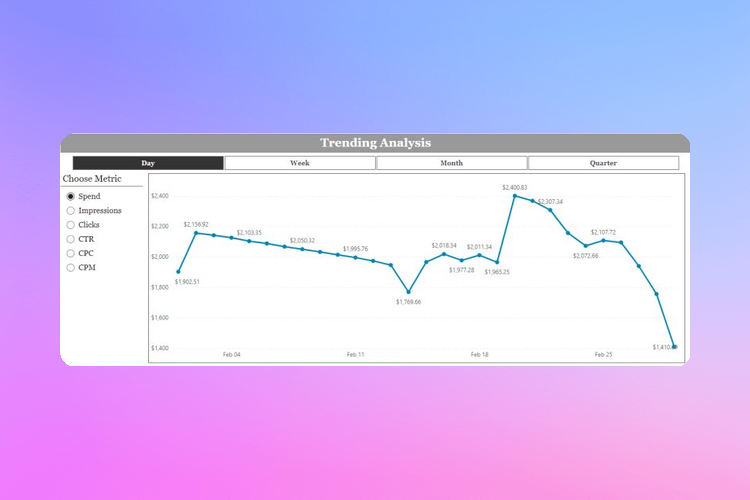
Microsoft Power BI's Field Parameters feature enables users to consolidate multiple visuals into one, and dynamically switch metrics or dimensions. Users can add parameters like Numeric Ranges and Fields to their reports, selecting which metrics to view. These parameters can be added to the report canvas as a slicer for the chosen visuals. This enhances report interactivity, reduces noise, and aids in focused analysis and decision making.
Microsoft PowerBI now allows users to create custom, toggle-able filter panes using two simple Bookmarks. This feature makes reports more interactive and less cluttered as it can be toggled in and out of view. Users can also add Tooltips to guide others through this functionality. Additionally, it can be combined with Dynamic Text Headers to display filter settings, and a third Bookmark can be added to clear all filters in a single click.
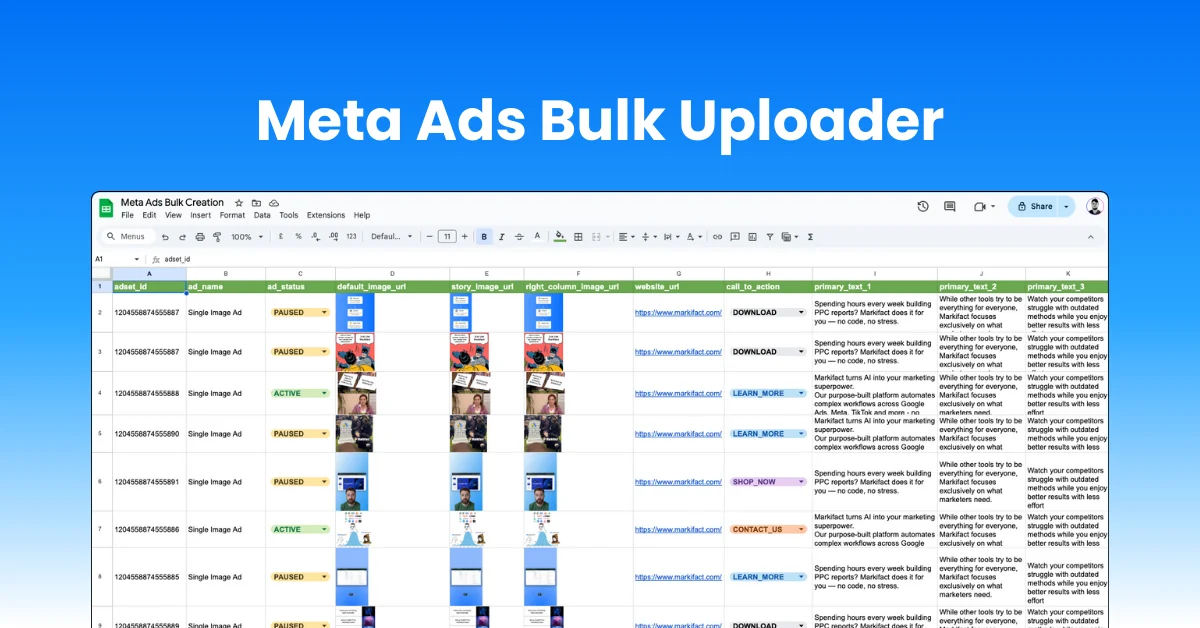
Upload all Meta ad types in bulk directly from Google Sheets, single image, video, carousel, and flexible ads. Control placements, multiple headlines, primary texts, descriptions, and creatives from one spreadsheet. Built for agencies and teams managing dozens of ads across multiple accounts, helping you launch faster, stay consistent, and avoid costly manual errors.