Google has published a guide on best practices for prompting in BigQuery data canvas. The guide focuses on using natural language prompts to perform various data tasks, leveraging the Gemini foundation model in the BigQuery ecosystem. Here are the key points and tips from the guide:
Introduction to BigQuery Data Canvas
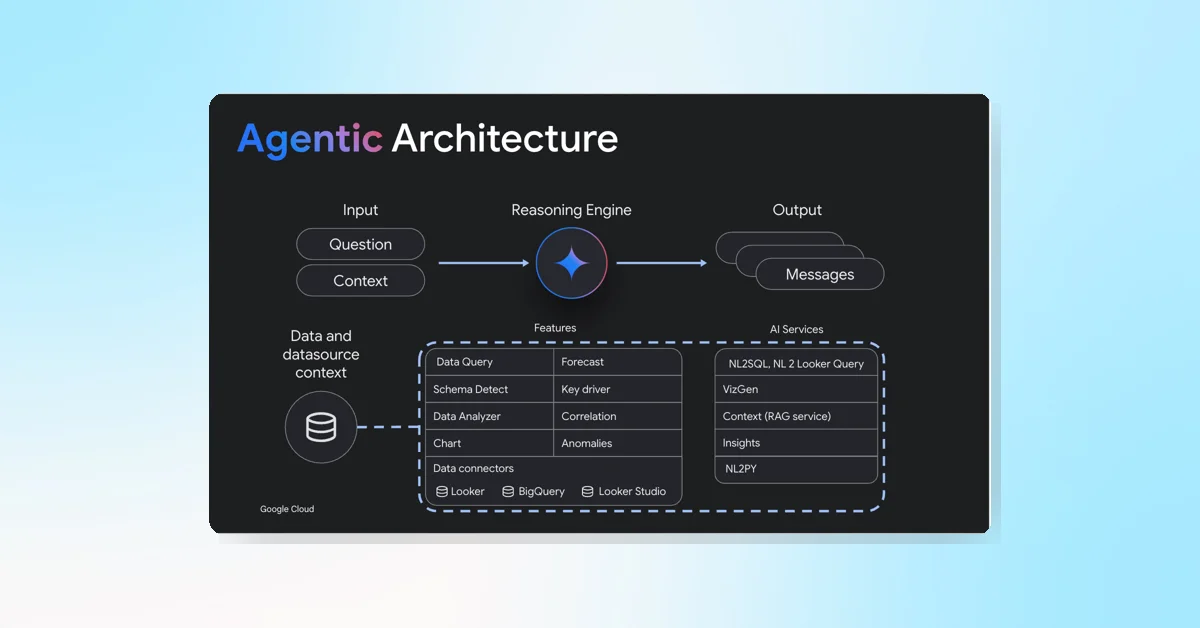
- Gemini Model: Facilitates finding data, creating SQL, generating charts, and creating data summaries using natural language (NL) prompts.
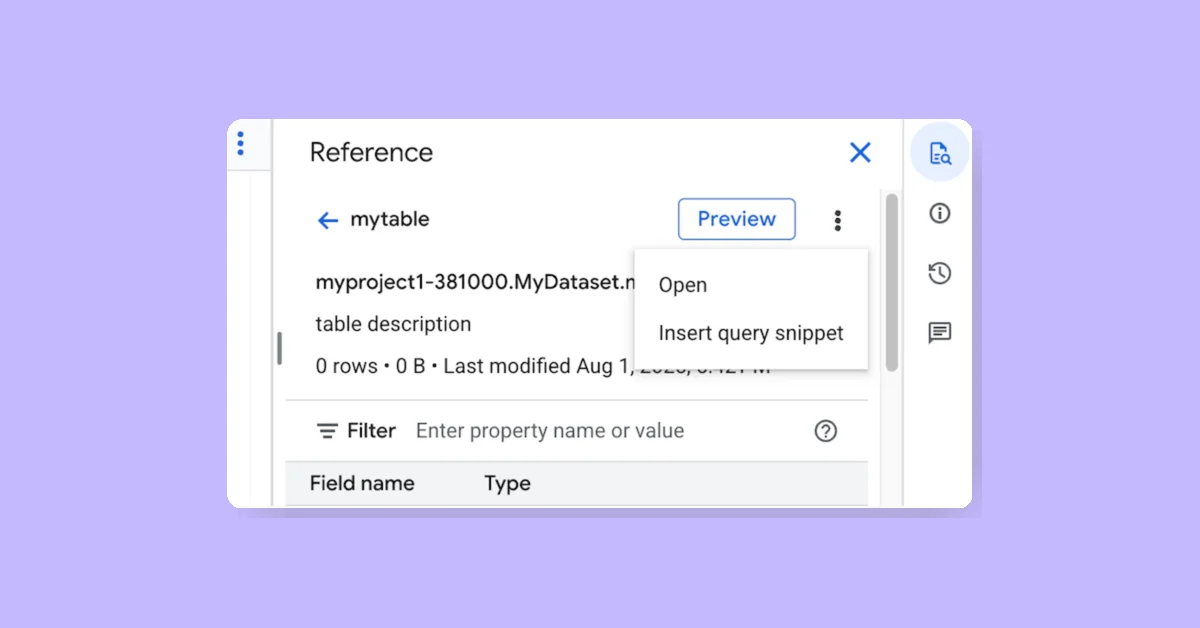
- Data Canvas: Allows users to locate, join, and query table assets, visualize results, and collaborate, thereby accelerating analytics and saving time.
Tips for Effective Prompting
1) Clarity is Key
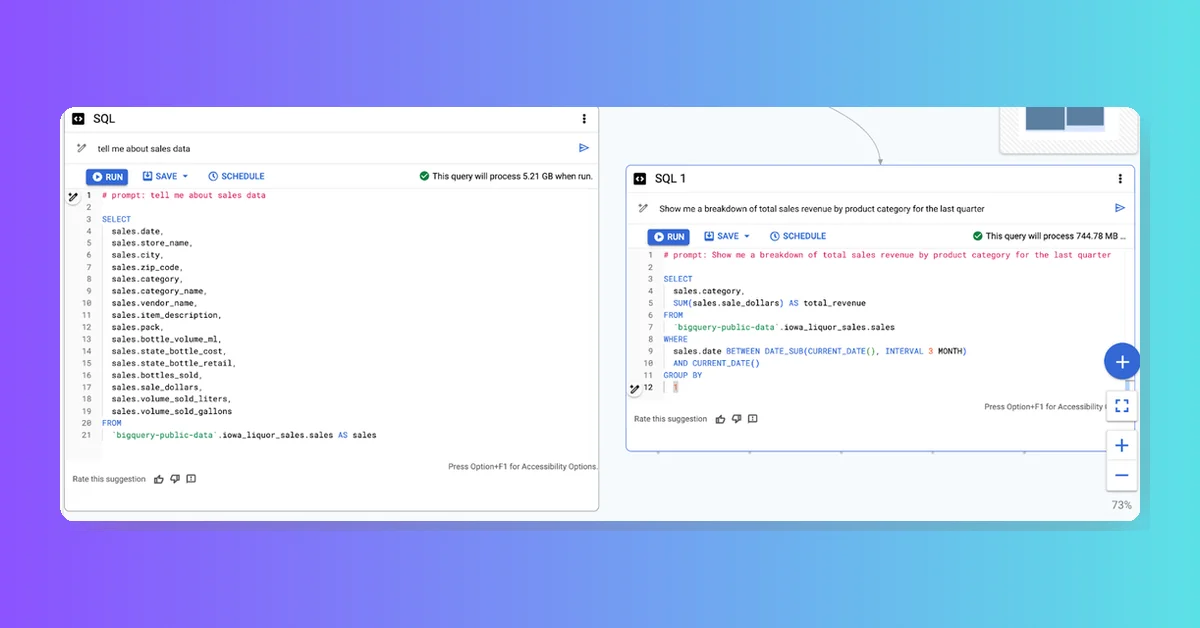
- Precision Over Ambiguity: Clearly state requests to avoid incomplete or inaccurate SQL.
- Example: "Show me a breakdown of total sales revenue by product category for the last quarter."
- Context Matters: Provide relevant background information.
- Example: "What's the trend of monthly active users for our mobile app over the past year?"
- Complete Sentences: Use full sentences with more details.
- Example: "Convert months in integers to its complete month name for committer's date."
2) Ask Direct Questions
- Single Question Focus: Ask one question at a time with detailed instructions.
- Example: Separate complex requests into multiple nodes.
- Avoid Overloading: Keep prompts concise to avoid overwhelming the model.
3) Give Focused and Explicit Instructions
- Emphasize Key Terms: Highlight important terms to guide the model's understanding.
- Example: "List all columns by unnesting author and committer by prefixing the record name to all the columns."
- Order of Operations: Provide instructions in a clear and ordered manner.
- Example: Start with the goal and break down complex tasks into smaller steps.
4) Specify Order of Operations
- Clear Instructions: Ensure the model accurately understands the task by providing clear, ordered instructions.
- Example: "Match repo name for the first entry only in the repeated column that has name like GoogleCloudPlatform."
5) Refine and Iterate
- Experiment: Try different phrasings and approaches.
- Learn from Feedback: Use the model's responses to adjust prompts and improve future interactions.
6) Creating Charts with NL2Chart
- Specific and Concise Prompts: Clearly state the type of chart and specific data to visualize.
- Example: "Create a bar chart showing the sales revenue of each product category in the last quarter."
- Define Data and Timeframe: Specify exact data points and time periods.
- Example: "Generate a line chart comparing the stock prices of Apple and Microsoft from January 1, 2020, to December 31, 2023."
- Customization: Include preferences for colors, styles, or specific formatting options.
For more details and examples, please visit the guide below.