Tableau Inspiration: Track Help Desk Performance
1 years ago
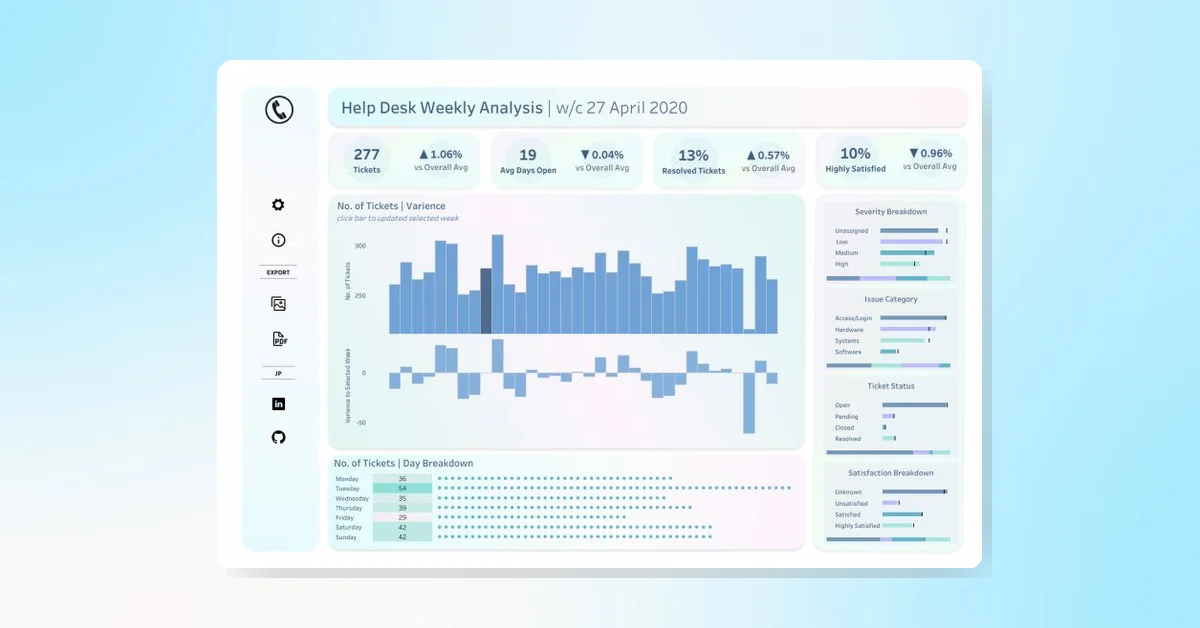
John Power's business dashboard visualizes weekly help desk performance, including tickets received, average days open, cases resolved, and status. Explore the visualization on Tableau Public.