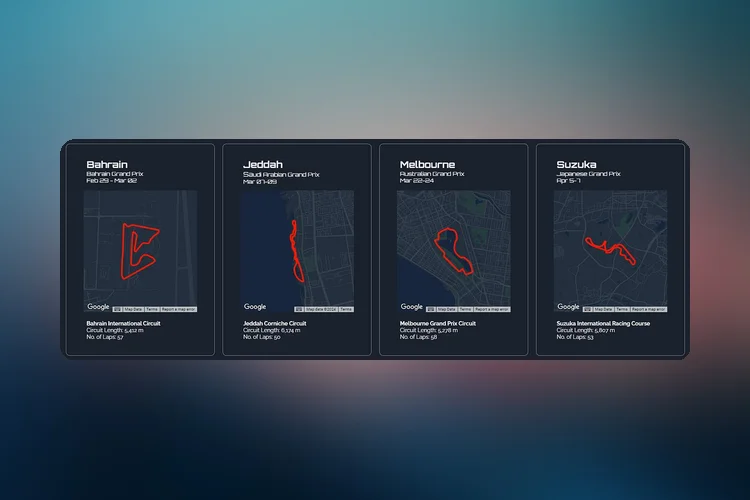
The text shares the author's experience of creating a Formula 1 Circuits visualization in Looker Studio. It also provides a step-by-step guide for readers to create their own geospatial visualizations. The author uses tools like Looker Studio and BigQuery for data visualization.
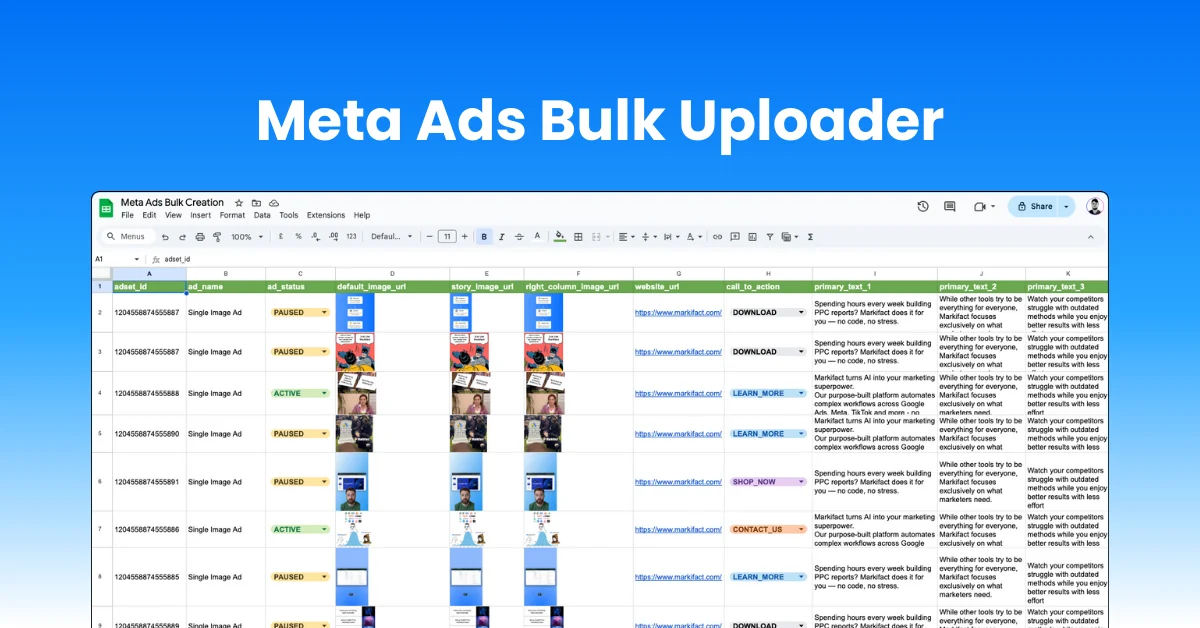
Upload all Meta ad types in bulk directly from Google Sheets, single image, video, carousel, and flexible ads. Control placements, multiple headlines, primary texts, descriptions, and creatives from one spreadsheet. Built for agencies and teams managing dozens of ads across multiple accounts, helping you launch faster, stay consistent, and avoid costly manual errors.