Andy Kriebel

Browse by source sorted by latest

Double Your Tableau Dashboard Quality with These Steps Today

Double Your Tableau Dashboard Quality with These Steps Today

1 years ago

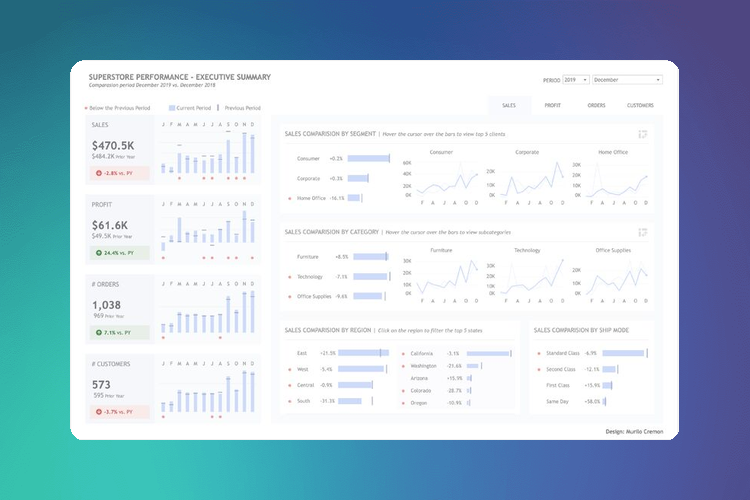
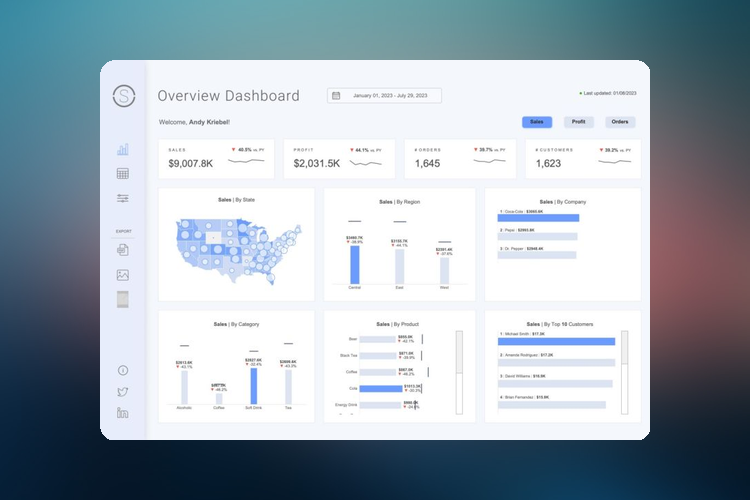
To enhance the quality of Tableau dashboards, follow these steps: search Tableau Public, download workbooks to understand their structure, open the workbook, connect to your data, swap out the data source, adjust the formatting, publish to your Tableau Server or Tableau Cloud, and share with stakeholders. This process can potentially double your productivity. Guidance is provided for swapping out data using a dashboard by Priya Padham as an example.

You want to improve your dashboard designs?

You want to improve your dashboard designs?

1 years ago

To enhance dashboard designs, seven key skills are recommended: utilizing simple charts, maintaining color consistency, understanding user needs, seeking feedback for iterations, providing ample layout space, prioritizing the display of crucial metrics, and incorporating interactivity for increased engagement. The design advice is provided by Murilo Cremon.

Google Ads Monthly Slides with AI Insights

Google Ads Monthly Slides with AI Insights

Featured

Create professional Google Ads performance reports in Google Slides with AI insights and visualizations. Transform Google Ads data into polished presentations featuring AI-generated insights and custom visuals to impress stakeholders and streamline reporting. Use cases include reducing manual reporting time, presenting insights without design skills, maintaining reporting schedules, identifying trends, and sharing campaign insights for strategic decisions.

Markifact
Markifact

Verified Sponsor

Verified Sponsor

Markifact is a Verified Sponsor. Want to get featured here? Contact us.

Verified Sponsor