Peter Šutarík

Browse by source sorted by latest

GA4 Interface Update: Interactive Line and Bar Charts Reflect Table Interactions

GA4 Interface Update: Interactive Line and Bar Charts Reflect Table Interactions

1 years ago

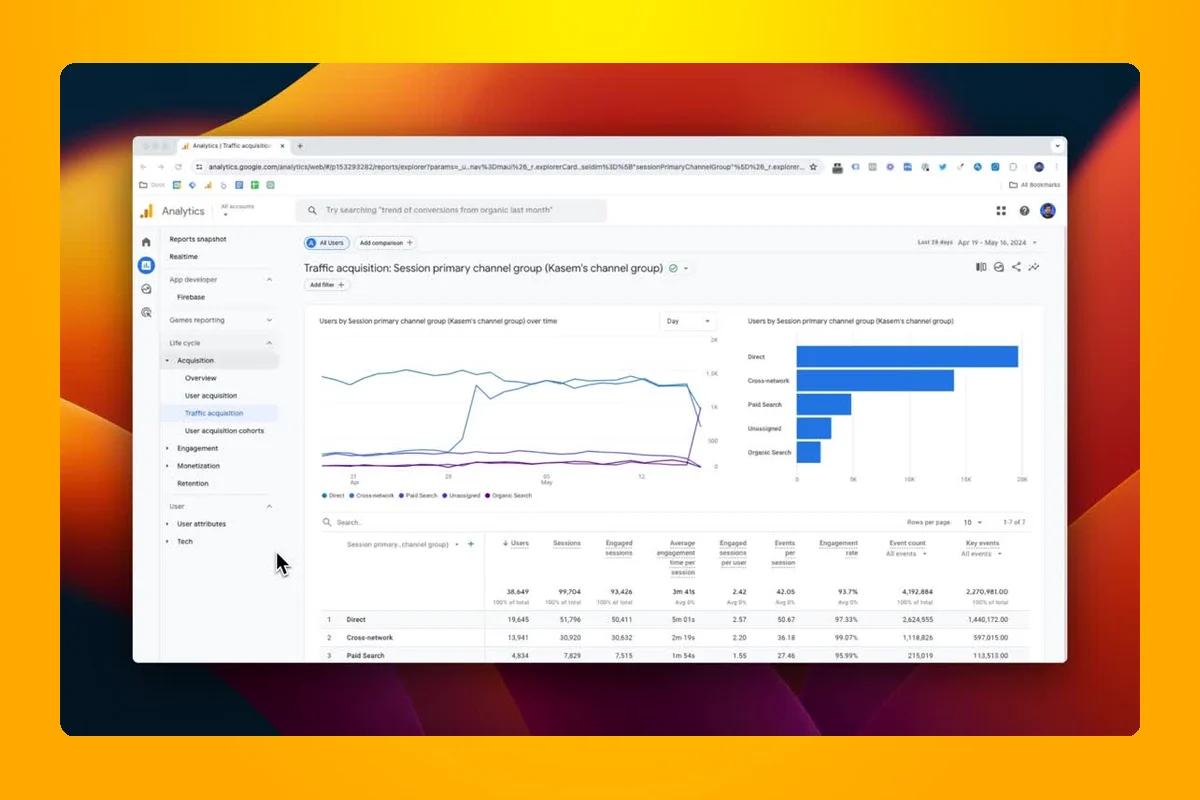
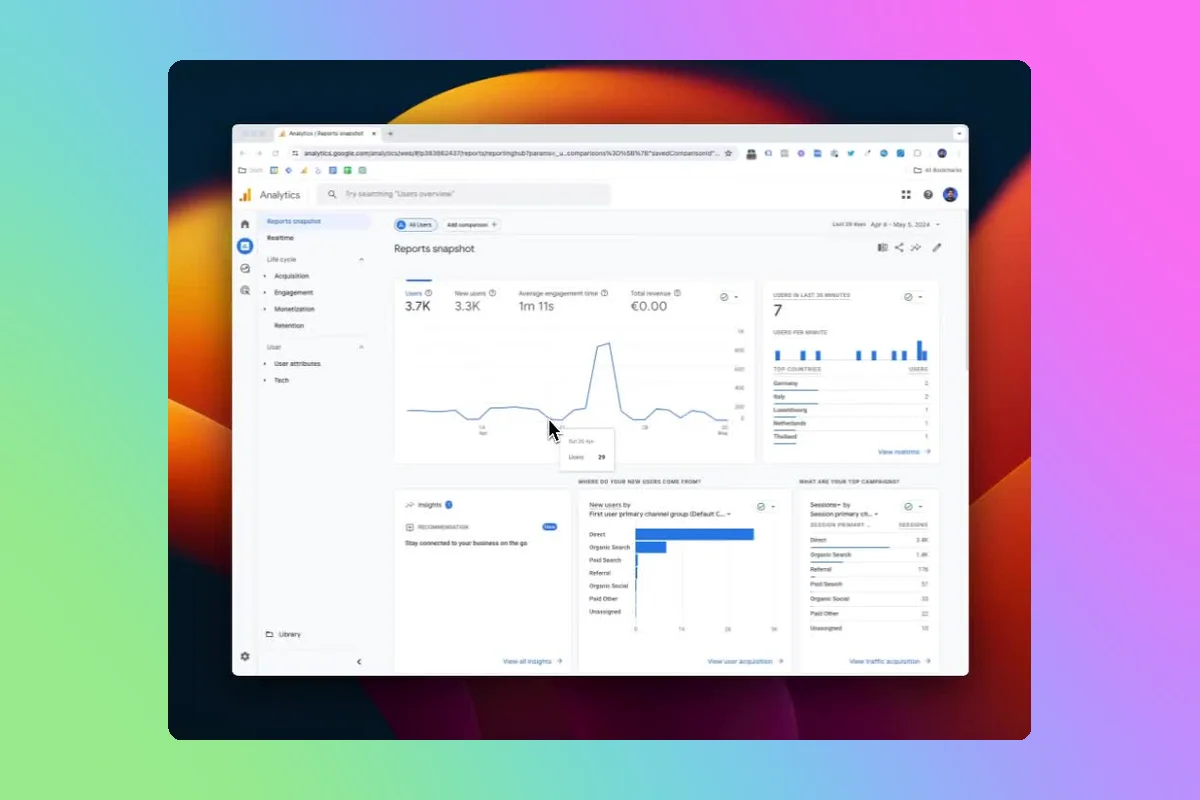
GA4 Line and Bar charts now dynamically adjust based on interactions with the underlying table. The displayed metric on the charts changes according to the metric sorted in the table. Additionally, if the table is filtered, the charts display only the values included in the filtered table. This feature may not be immediately apparent but is highly beneficial once understood.
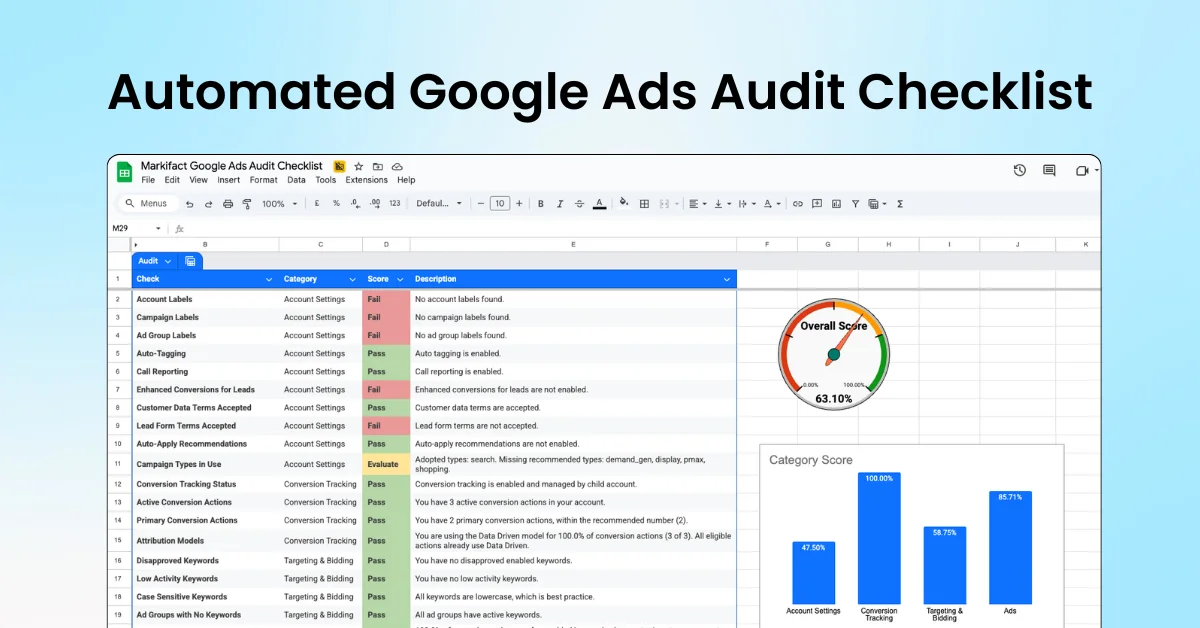
Google Ads Monthly Slides with AI Insights

Google Ads Monthly Slides with AI Insights

Featured

Create professional Google Ads performance reports in Google Slides with AI insights and visualizations. Transform Google Ads data into polished presentations featuring AI-generated insights and custom visuals to impress stakeholders and streamline reporting. Use cases include reducing manual reporting time, presenting insights without design skills, maintaining reporting schedules, identifying trends, and sharing campaign insights for strategic decisions.

Markifact
Markifact

Verified Sponsor

Verified Sponsor

Markifact is a Verified Sponsor. Want to get featured here? Contact us.

Verified Sponsor
Google Analytics 4 Rolls Out Saved Comparisons for Efficient Segment Analysis

Google Analytics 4 Rolls Out Saved Comparisons for Efficient Segment Analysis

1 years ago

GA4 now allow users to save Comparisons (Segments) in standard reports, promising significant time savings for frequent segment users.